WSS Providers Data
Nwasco has licensed 11 Commercial Utilities and 4 Private Schemes.
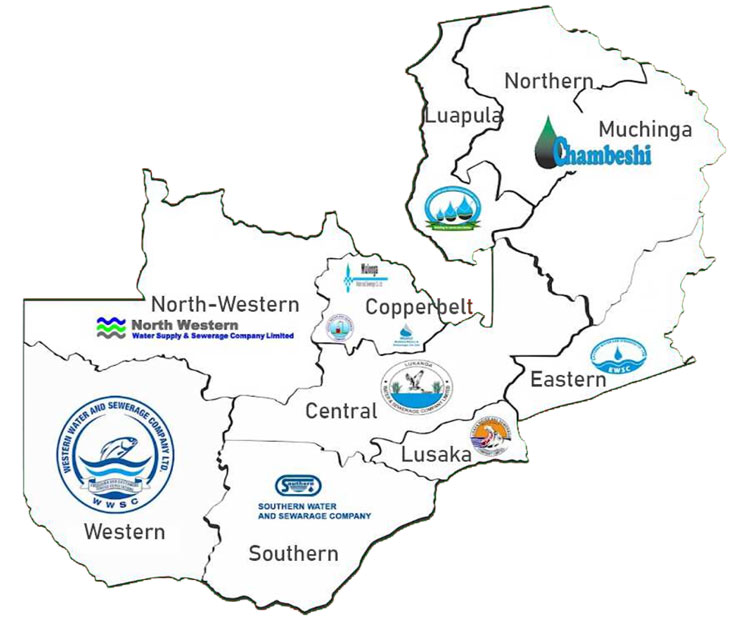
| Commercial Utility | Abbreviation | Start of Operations | No. of Towns/ Centres Serviced | Total Population in Commercial Utility | No. of Connections | No. of Staff |
| Chambeshi Water and Sanitation Company | CHWSC | 2018 | 15 | 465,370 | 116,096 | 10 |
| Eastern Water and Sanitation Company | EWSC | 2018 | 10 | 337,178 | 101,092 | 8 |
| Kafubu Water and Sewerage Company | KWSC | 2018 | 3 | 722,534 | 258,200 | 15 |
| Luapula Water and Sanitation Company | LPWSC | 2018 | 7 | 242,778 | 38,420 | 14 |
| Lukanga Water and Sanitation Company | LGWSC | 2018 | 12 | 439,716 | 127,620 | 7 |
| Lusaka Water and Sanitation Company | LWSC | 2018 | 6 | 2,636,964 | 513,587 | 6 |
| Mulonga Water and Sanitation Company | MWSC | 2018 | 3 | 541,988 | 279,192 | 8 |
| Nkana Water and Sanitation Company | NWSC | 2018 | 3 | 800,304 | 319,513 | 21 |
| North Western Water and Sanitation Company | NWWSC | 2018 | 13 | 343,272 | 81,798 | 9 |
| Southern Water and Sanitation Company | SWSC | 2018 | 21 | 425,303 | 276,031 | 10 |
| Western Water and Sanitation Company | WWSC | 2018 | 17 | 217,652 | 60,237 | 1 |
National Urban Water and Sanitation Coverage
| 2019 | 2020 | 2021 | |
|---|---|---|---|
| Total Urban Population | 7,352,862 | 7,595,910 | 7,808,105 |
| Total Urban Population Served with Water | 6,244,247 | 6,575,615 | 6,913,881 |
| Total Urban Population Served with Sewerage | 0 | 0 | 0 |
| National Urban Water Coverage | 84.92 % | 86.57 % | 88.55 % |
| National Urban Sanitation Coverage | 0.00 % | 0.00 % | 0.00 % |
Total Connections
| Commercial Utility | Total Domestic 2020 | Total Non-Domestic 2020 | Total Connections 2020 |
Total Connections 2021 |
|---|---|---|---|---|
| CHWSC | 24,947 | 466,087 | 26,825 | 1,883 |
| EWSC | 22,186 | 342,281 | 23,963 | 1,818 |
| KWSC | 67,012 | 780,290 | 69,836 | 2,840 |
| LPWSC | 7,905 | 231,743 | 8,564 | 667 |
| LGWSC | 27,289 | 458,805 | 29,256 | 2,001 |
| LWSC | 107,264 | 2,835,047 | 118,584 | 15,162 |
| MWSC | 58,166 | 560,341 | 61,408 | 3,097 |
| NWSC | 66,826 | 863,408 | 70,395 | 3,634 |
| NWWSC | 17,107 | 293,995 | 18,448 | 1,331 |
| SWSC | 58,583 | 521,385 | 61,832 | 3,201 |
| WWSC | 12,849 | 242,528 | 13,794 | 1,088 |
| Commercial Utility | Total Population 2020 | Population Served 2020 |
Proportion of Population Serviced by Household Connections 2020 | Proportion of Population Serviced by Public Standposts & Kiosks 2020 |
Total Population 2021 |
Population Served 2021 |
Proportion of Population Serviced by Household Connections 2021 | Proportion of Population Serviced by Public Standposts & Kiosks 2021 |
|---|---|---|---|---|---|---|---|---|
| Chambeshi Water and Sanitation Company | 466,087 | 373,404 | 41 % | 18 % | 489,458 | 398,675 | 45 % | 10 % |
| Eastern Water and Sanitation Company | 342,281 | 304,069 | 45 % | 10 % | 341,827 | 314,421 | 48 % | 4 % |
| Kafubu Water and Sewerage Company | 780,290 | 673,342 | 78 % | 22 % | 791,548 | 680,704 | 77 % | 23 % |
| Luapula Water and Sanitation Company | 231,743 | 116,442 | 32 % | 4 % | 237,160 | 122,845 | 34 % | 32 % |
| Lukanga Water and Sanitation Company | 458,805 | 376,333 | 33 % | 1 % | 473,128 | 400,819 | 36 % | 28 % |
| Lusaka Water and Sanitation Company | 2,835,047 | 2,540,541 | 48,100 % | 4 % | 2,924,726 | 2,740,603 | 50 % | 0 % |
| Mulonga Water and Sanitation Company | 560,341 | 546,218 | 78 % | 22 % | 581,907 | 545,579 | 73 % | 27 % |
| Nkana Water and Sanitation Company | 863,408 | 846,571 | 71 % | 29 % | 889,307 | 872,720 | 71 % | 29 % |
| North Western Water and Sanitation Company | 293,995 | 206,003 | 36 % | 28 % | 301,416 | 214,833 | 36 % | 28 % |
| Southern Water and Sanitation Company | 521,385 | 488,335 | 82 % | 18 % | 530,751 | 507,089 | 85 % | 15 % |
| Western Water and Sanitation Company | 242,528 | 104,357 | 37 % | 26 % | 246,877 | 115,593 | 44 % | 12 % |
| 11 CUs | 7,595,910 | 6,575,615 | 58 % | 42 % | 7,808,105 | 6,913,881 | 58 % | 42 % |
| Commercial Utility | Total Sewer Connections 2020 | Total Sewer Connections 2021 |
|---|---|---|
| Chambeshi Water and Sanitation Company | 4 | 4 |
| Eastern Water and Sanitation Company | 5 | 5 |
| Kafubu Water and Sewerage Company | 49 | 50 |
| Luapula Water and Sanitation Company | 50 | 51 |
| Lukanga Water and Sanitation Company | 62 | 63 |
| Lusaka Water and Sanitation Company | 100 | 102 |
| Mulonga Water and Sanitation Company | 155 | 157 |
| Nkana Water and Sanitation Company | 216 | 219 |
| North Western Water and Sanitation Company | 1010 | 807 |
| Southern Water and Sanitation Company | 1023 | 820 |
| Western Water and Sanitation Company | 1024 | 821 |
| Total | 821 | 7808105 |